Communicated Content – Area Under Receiver Operating Characteristic Curve allows calculating the performance of any machine learning model. However, in most cases, it is not fully understood or rather misunderstood, and its true nature cannot be used. Under the hood, these are very simple calculation parameters that just need to be explained.

ROC Curve
It helps to visualize how well the AI system is performing. The indicators change as the thresholds change. You can generate different matrices and compare them. However, it’s better to create a graph between some of these metrics, so you can easily see which threshold gives the best result. The AUC ROC in practice solves exactly this problem.
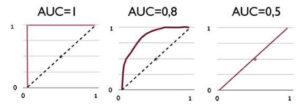
The area under the curve is a measure of a classifier’s ability to distinguish between classes:
- When it is equal to one, then the classifier can correctly distinguish between all points of the class.
- If it is 0, the system predicts all negative values as positive and vice versa.
- When 0.5 < AUC < 1, there is a high probability that the classifier can distinguish between class values.
- If AUC = 0.5, then the classifier cannot estimate positive and negative class scores.
With ROC, you can compare models and their parameters to choose the most optimal combination in terms of results. In this case, a compromise is sought between the points whose label was correctly defined as positive and the number of points whose label was incorrectly defined as positive.
Area Under Curve
As a numerical estimate of the receiver operating characteristic line, it is customary to take the area under this curve, which is a good “result”. If between X and Y there is a dominance of the first over the second, the opposite is not always true. However, the area under the curve also has a statistical meaning: it measures the probability that a negative class will be less likely to be recognized as a positive one.
AUC ROC can be used to visualize model performance between sensitivity and specificity. Sensitivity refers to the ability to correctly identify entries that fall in the positive class. Specificity refers to the ability to correctly identify entries that fall into the negative class. In other words, these metrics can help you determine how well your model can distinguish between classes.
Knowing how AUC ROC is calculated is as significant as using it. The considered metrics are only basic and only for the classification problem. There are still many areas in which they will be different because each task has its specifics and priorities. In most cases, it is recommended to use these metrics because they include a wide list of possible outcomes and more accurately reflect the performance of artificial intelligence systems.